Lendingclub: predicting loan outcome

Here I have built a model to predict whether a loan will default or not using data from Lending Club, an innovative peer-to-peer lending company. The dataset contains information on several thousands of loans, mostly basic financial and personal details. The model employs a logistic regression using Bayesian inference.
The data was imported from a csv file that Lending Club had released publically. Here is some intial EDA:
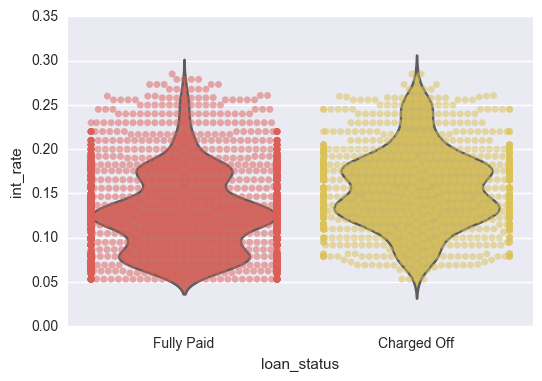
This first image demonstrates the distribution of interest rates from good and bad loans. As can be seen, the bad loans have a higher average interest rate. This shows that Lending Club has already determined these customers to have higher risk based upon other metrics.
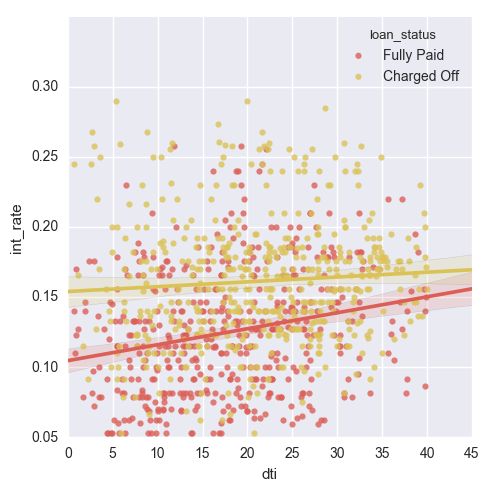
Here we have a scatterplot of interest rate to debt-to-income (DTI). The two regression lines are colored differently with respect to payment of loan. Customers who defaulted had paid a higher interest rate, regardless of debt-to-income, although the difference became less pronounced as DTI increased.
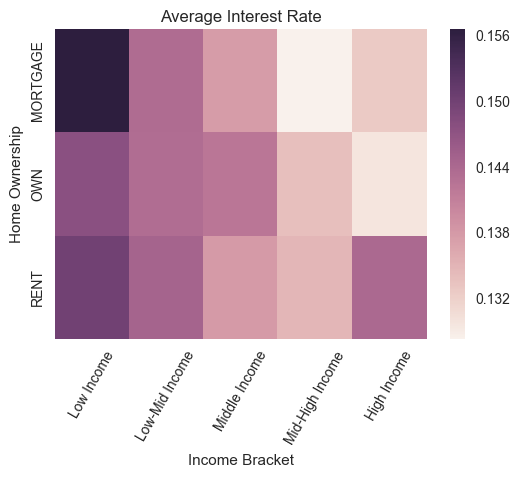
Below is a heat map of the interest rates for customers based on their home ownership and income level. The darker red indicates higher interest rates. Income clearly has a negative effect on interest rates and home-ownership also has a relationship with rates.
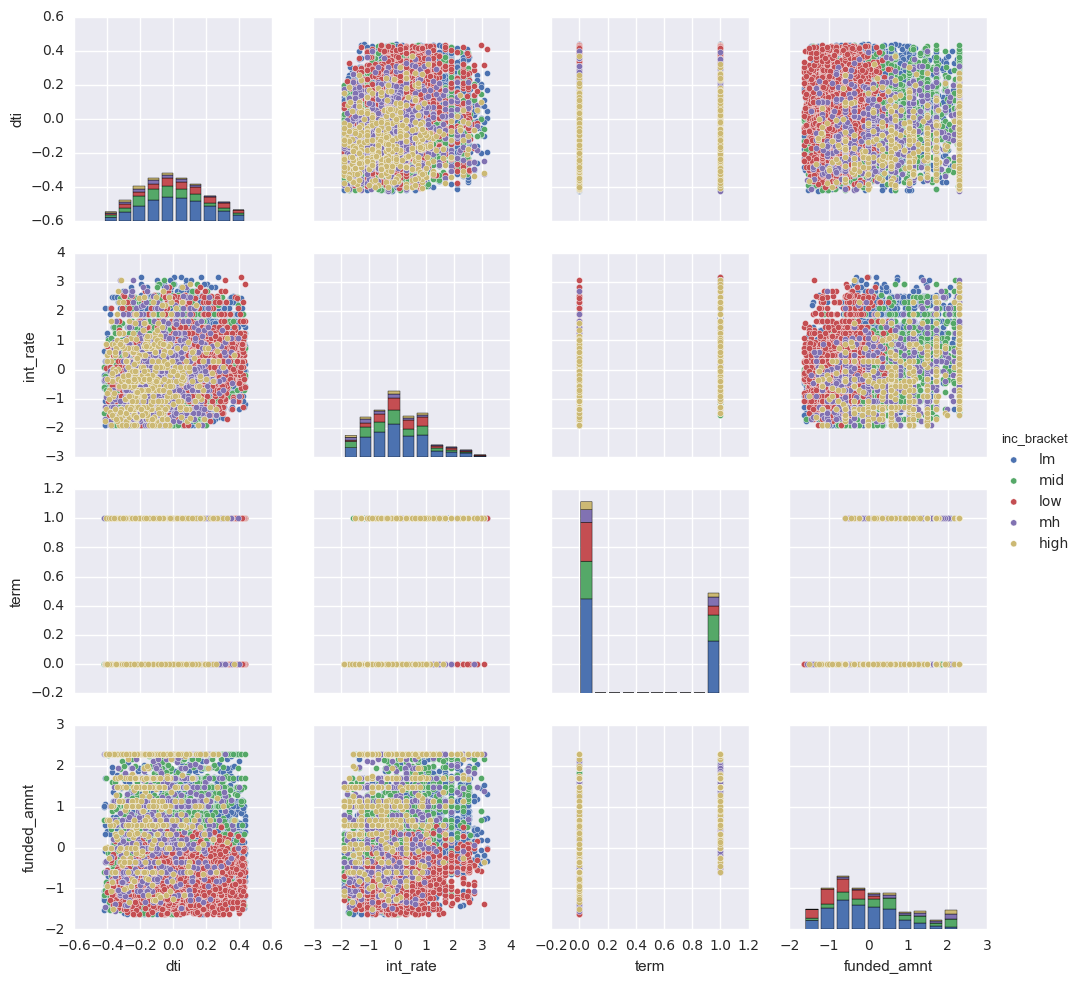
Finally, I used a pairplot to visualize the relationships between various features. I used a different hue for each income class to further display linear tendencies among variables.
Next, the data was normalized and the categorical columns were dummified.
At this point I was able to begin modeling the data. I wrote out functions that calculated the predictive likelihood and posterior distributions. The regression is modeled as follows:
g(x)= ω0 + ω1(income) + ω2(dti) + ω3(interest) + ω4(term) + ω5(funded) + ω6(mortgage) + ω7(own)
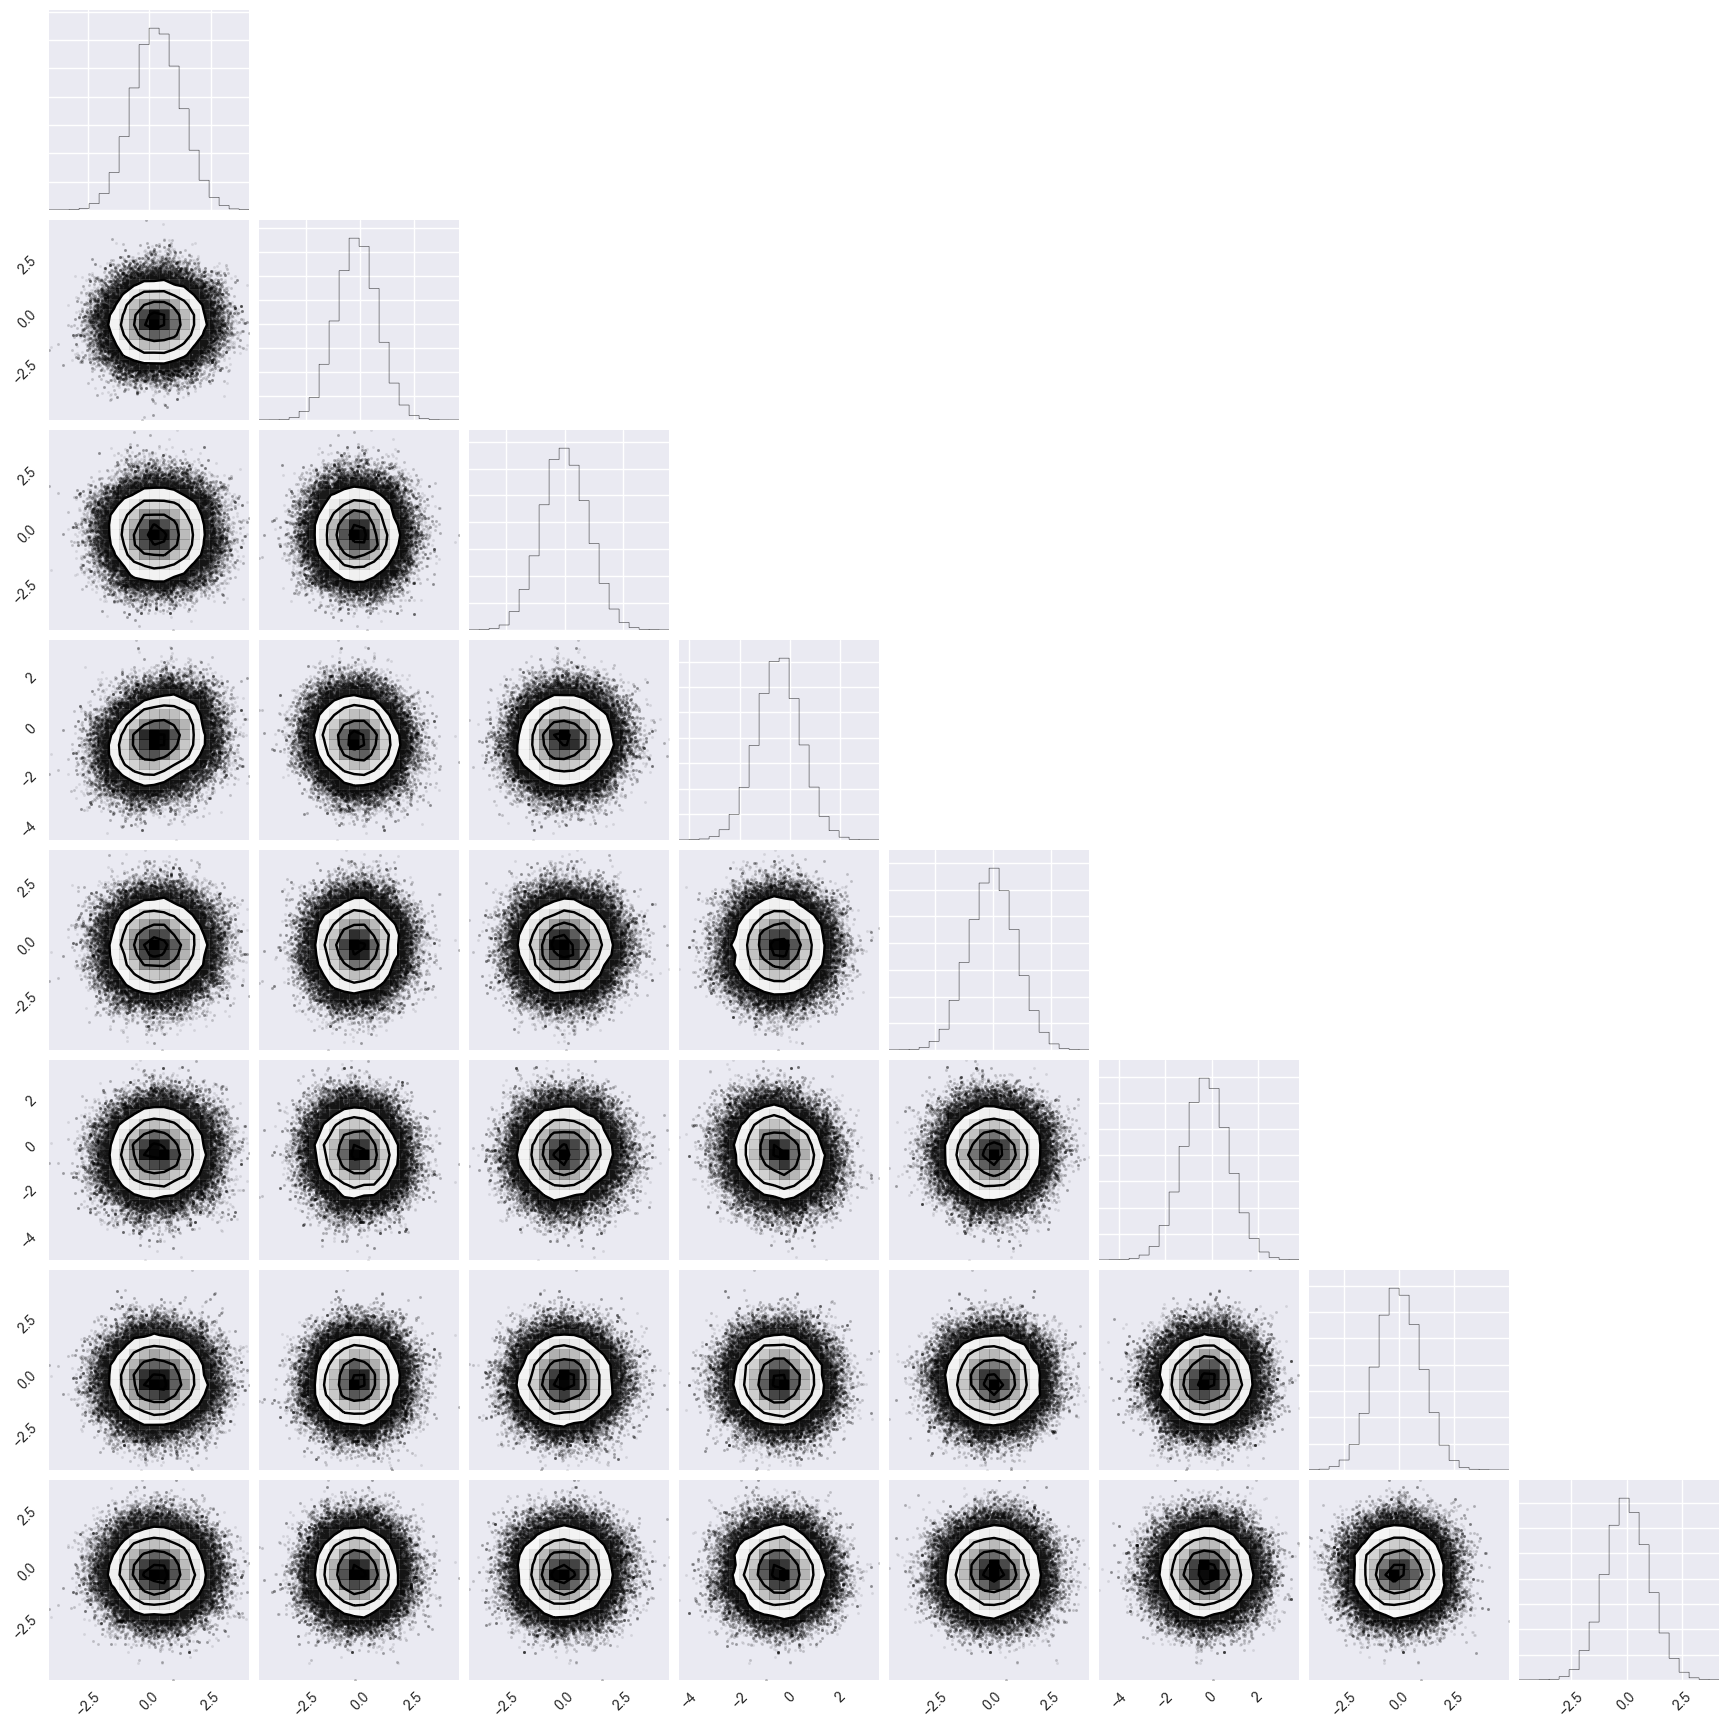
Using the functions I now was able to run the Monte Carlo-Markov Chain to sample from my posterior distribution. This returns the most likely values for my hyperparameters.
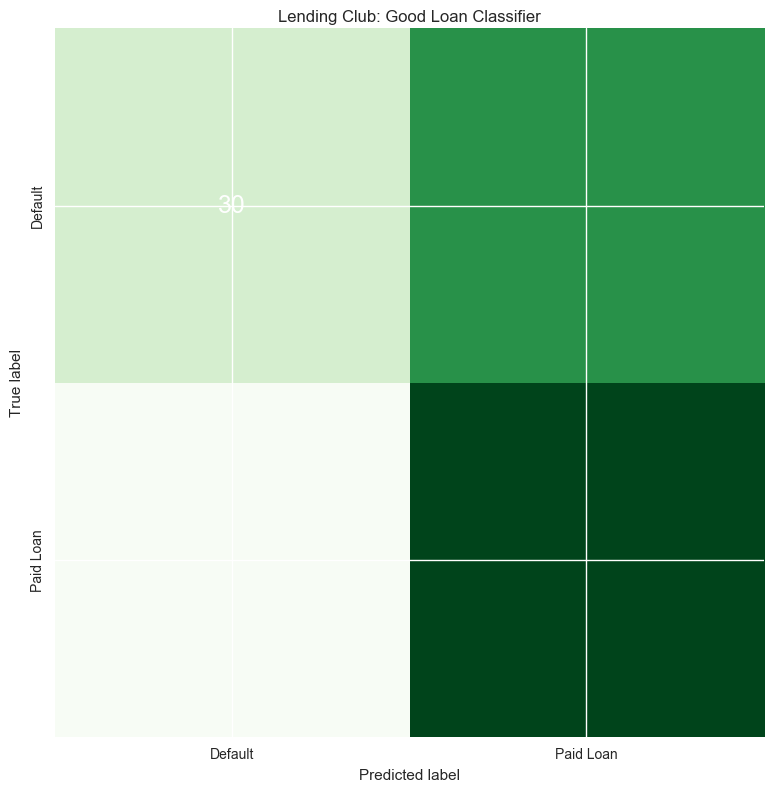
With the values for my parameters I continued on to predict the outcome of several lines of data, from which I also had the information of the loan status, and thus could verify if the model worked well or not. I found that my model does give higher probability to customers paying when they do (true positives) than customers defaulting, but the probability estimate is greater than 50% (the amount of defaults in the dataset) so there would be many false positives.