Maximum likelihood
In this project I have calculated the Maximum Likelihood of a gamma function given certain observations. The gamma distribution has a wide range of applications and is used often to model waiting times in many different fields.
I began by assuming that all waiting times are distributed about the same unknown gamma distriubted with fixed hyperparameters.
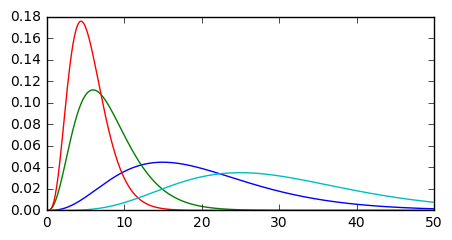
Alpha and beta are the shape and rate parameters, respectively. This graph shows the gamma distribution with different shape parameters. To plot I created a lambda expression for the gamma distribution, utilizing the gamma function in the scipy.special package.
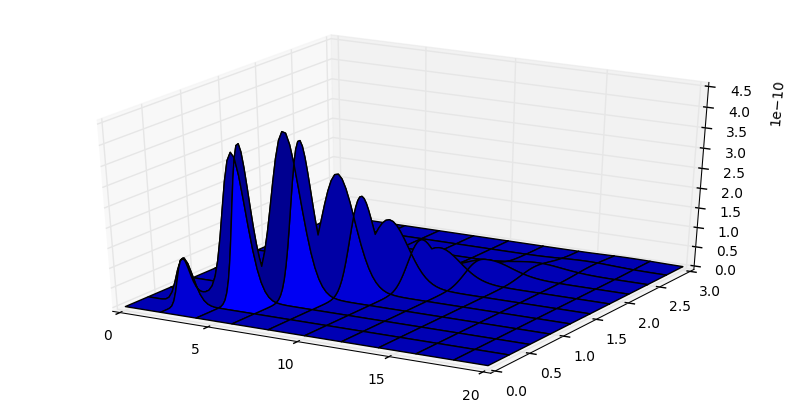
Next I took a collection of waiting times that were measured. The idea is to create a three dimensional plot that shows the probability of alpha and beta hyperparemeters given the waiting times that were observed. I iterated through each combination of hyperparameters and calculated the cumulative probability of each of observed waiting times. I then wrote a lambda expression that mapped every alpha-beta pair onto the probability, thus forming a 3D plot.
Given the previous model/plot that shows us the likelihood of the observed waiting times given fixed hyperparameters where hyperparameters are x and y (z is the probability) in a three dimensional grid, it is possible to use the minimize function (scipy.optimize) by inverting the model/plot which in this case will return the two hyperparameters which produce the highest probability for the measured events. This is known as the maximum likelihood estimation (MLE).
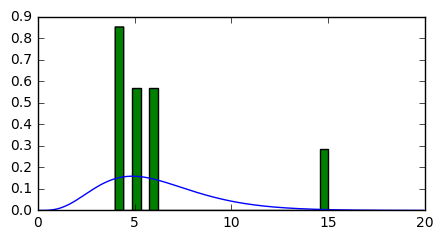
I then used the maximum likelihood solution to plot the probability distribution, using my gamma function from before with set values for alpha and beta (from MLE) and iterating across the x-axis. Here I have overlayed a histogram of the waiting times.