Modeling wave height: a bayesian regression
This model is intended to predict the likelihood that the tide is above 15 feet in order to ensure the viability of a surf shack next to the beach. The data is organized in a dataframe with time and tide height at one specific location as the two variables. I will build a bayesian regression and, thus, will have access to the exact probability of the tide (given the data being observed) being over 15 feet and can decide if that’s a risk worth taking.
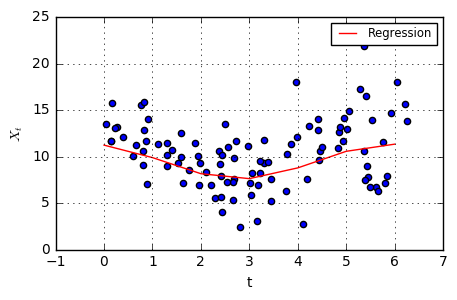
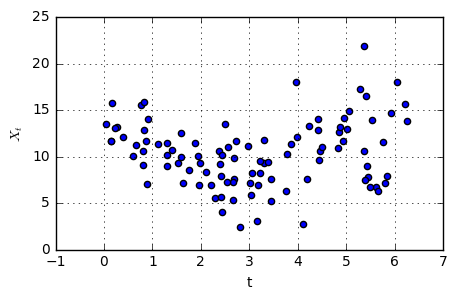
To begin, a visualization of the data in the form of a scatterplot. The data seems to oscillate repetitively, so a sine or cosine wave could be used in the regression.
Next, I create a function with one argument (a list of parameters for our model) that returns the natural log of the posterior, the log prior plus the log likelihood (likelihood * prior). When the function is called, the log likelihood is calculated with an iteration through the data. Because the data takes the shape of sinosoidal wave, I have set my likelihood function used the following parameters and form to model the regression line of the wave height as such:
μ(t)=ω0+ω1sin(t)+ω2cos(t)
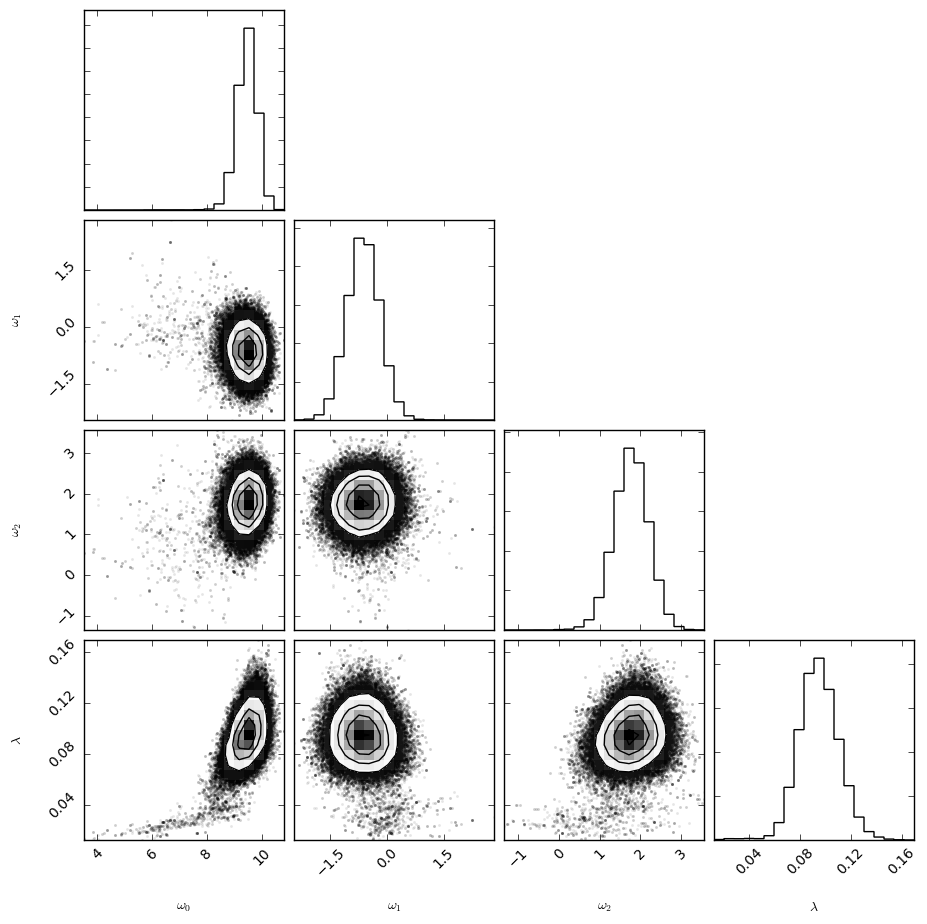
At this point I employed the emcee sampler (Monte Carlo-Markov Chain) to sample from my posterior distribution. This returns the values for a specified amount of samplers, the values of which represent the possible values of each hyperparameter after a credible regression line has been made by each walker. Using the central limit theorem, you can now deduce the most likely values of each parameter, along with having available the distribution of each parameter.
I used the values of these hyperparameters to graph the regression line overlayed on the prior scatterplot to demonstrate the fit.
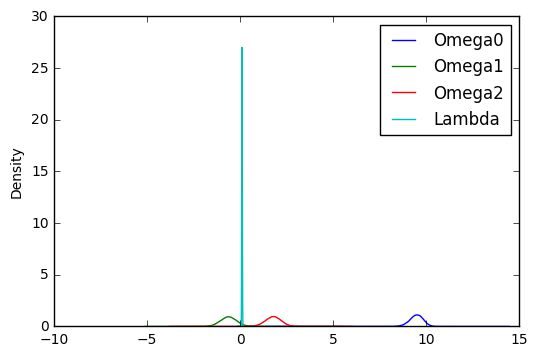
This following graph shows the probability densities of the hyperparameters, calculated from the histogram of the values of each hyperparemeter from the samples data collected from the emcee sampler.
And here is the corner plot, again for each of the hyperparameters.
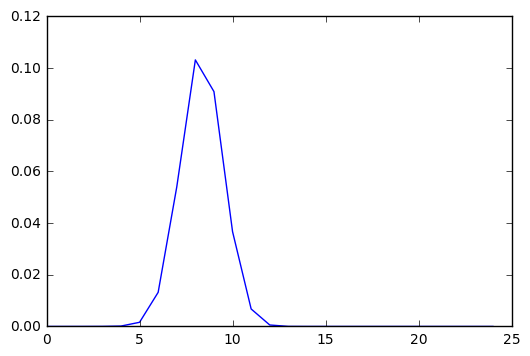
Now I am ready to reach some conclusions about the likelihood that the tide reaches the proposed building. I first graph the predictive distribution of the wave heights. I integrate over the regression line calculating the probabilites of heights that are normally distributed about this line and this gives me a probability distribution of heights. I can then integrate over the probability distribution of the tidal heights where the tide is higher than 15 feet (15 to infinity). In this case the probability was extremely low, however, in the scatterplot it is clear that the probability ought not be so miniscule. I am considering increasing the number of walkers and increasing the burn-out phase to improve the regression line and consequently providing more accurate predictions.