
Movielect: a movie recommendation engine
Movielect is a movie recommendation algorithm that aides users in their search for a movie to watch. The user simply indicates the streaming services (ie. Netflix, Hulu) he/she has subscriptions to and a movie to watch. Movielect then suggests a movie and indicates on which of the accessible websites it can be found. The recommendation will be the exact movie, if it is part of the content available, or in most cases, the most similar film based on variety of features.
Right now, it appears that the algorithm works relatively well, as a majority of the recommendations make intuitive sense. This particular algorithm, because I didn’t have user ratings for a large percentage of the catelogue, employs a content-based model, and thus the suggestion and based solely on the movies’ characteristics. That makes Movielect ideal for one-situations, when no prior knowledge of the user is available. Finally, I overlayed an element of plot similarity upon my model. This either enhanced or hindered the quality of the recommendation, as highly relevant words within the plot were overweighted in their importance.
I began the project by building a comprehensive list of movie titles. The base of this list comes from the MovieLens dataset, which has titles, and other attributes, of over 24,000 movies. In order to make my list current, an additional set of recently released movies was added from Rotten Tomatoes. Next, I decided to focus on five subscription-based content providers, Netflix, HBO, hulu, Amazon, and Showtime. I webscraped the data from Showtime and some from HBO. Data from the other three websites was copied and pasted to Excel, and later read into Python. Finally, I fed the clean list of titles into the IMDB api to populate a dataframe consisting of over 27,000 titles and around 25 features, including the plot, actors, year of realease, genre, votes, among others.
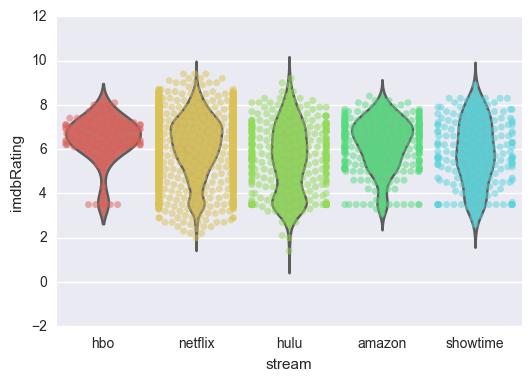
At this point I began my exploratory data analysis, cleaning/normalizing my data and dealing with null values along the way. Below is a violin plot of the movies belonging to each sites’ content base plotted against the IMDB rating. The plot is overlayed with a swarm plot which plots every movie belonging to that service. As shown in the graph, Netflix has the most extensive collection of titles, but HBO as the best quality of content, followed by Amazon.
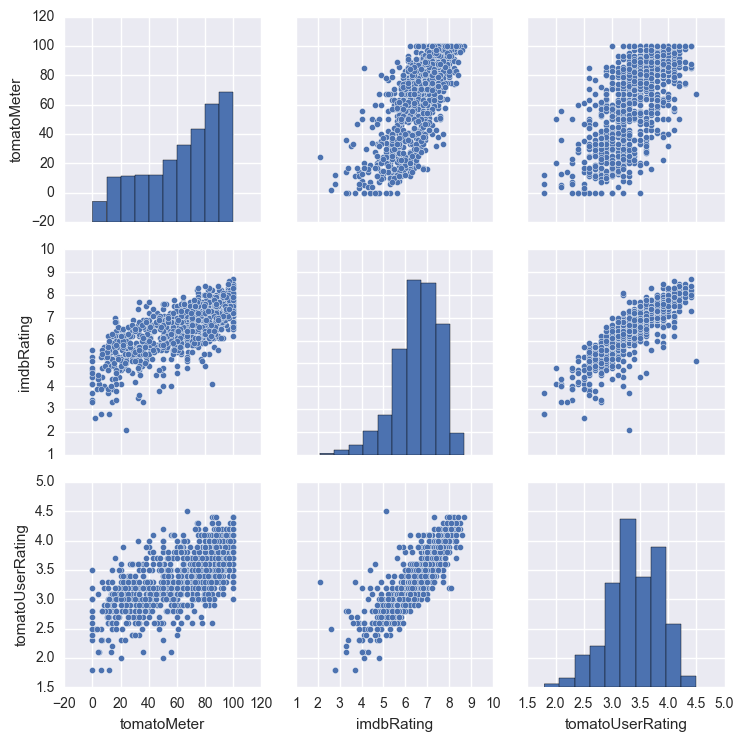
I began with no missing values for IMDB rating (user ratings) but about 10% null values in Rotten Tomatoes meter (critics) and Rotten Tomatoes rating (users). I used a pair plot to visualize the three features together and noticed a very strong linear relation, so the missing values were imputed using a linear regression.
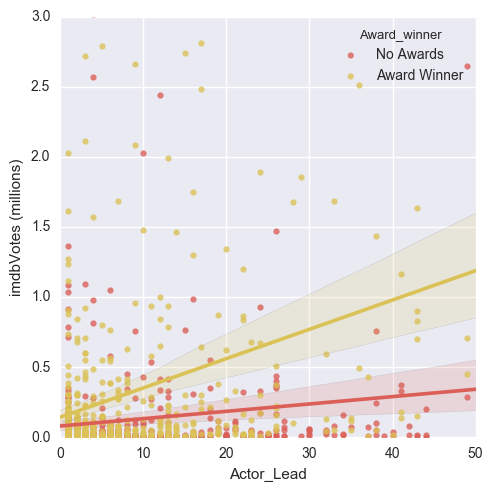
In the initial iteration of Movielect, the actor feature was dummified but I realized that the resulting matrix of features happened to be far too sparse leading to poor movie recommendation. In order to consolidate the features, I began engineering metrics that could utilized instead. In this instance, I used a ‘moviestar’ metric that quantified how many times the lead actor of a movie had appeared in all of the movies of the corpus. This scatterplot shows that the higher the moviestar quality, the greater the amount of votes (popularity) the movie has. The movies are further classified as an award winner or not. An award winning movie with a famous actor will likely have a large number of votes…not too surprising.
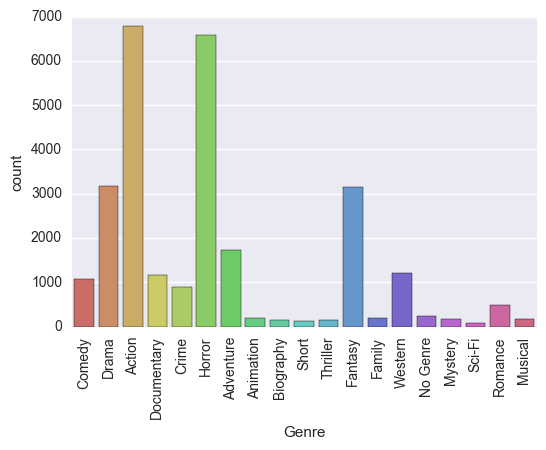
Here is a histogram of the movies classified my genre:
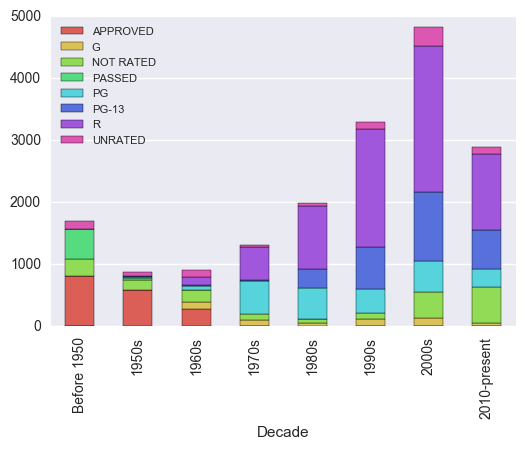
And by rating. Notice that before the 1970’s, films were rated on a different scale.
The memory-based model is a grid of the cosine distances between movies. Each movies’ features can be interpreted as a vector in the n-dimensional vector space, where the number of dimensions is equivalent to the number of dimensions. The higher the cosine distance between two vectors, the smaller the cosine angle between them. Thus, the two vectors (movies) are most similar as the cosine angle approaches 0 degrees and the cosine distance approaches 1.
An element of Natural Language Processing was added to the Movielect algorithm. I employed term frequency-inverse document frequency (tf-idf) on the entire corpus of plots as a weighting factor for the words in each plot. I then used dimensionality reduction (SVD method) to minimize the size of the matrix, while maintaining at least 75% of the variation, and allow for easier computation. The cosine distances between each of the plots was then computed in the same fashion as before.
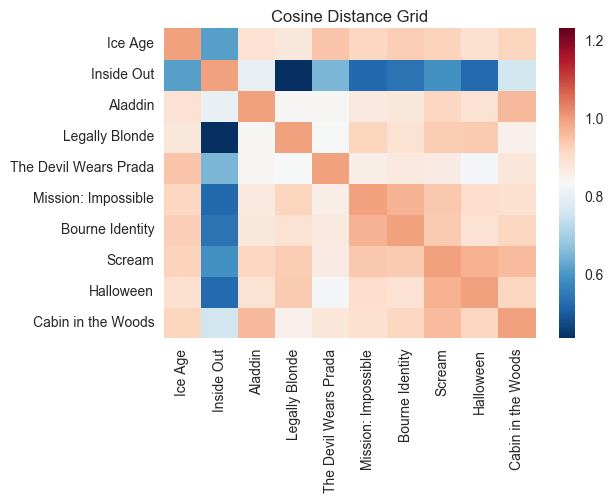
The two grids were then added together, arbitrarily weighing the two equally. Here is a small example of how the model looks:
In this case I placed, what I intuitively felt were similar movies, next to one another. The red then, should be brightest near the diagonal line traversing the grid. In this example the horror and action movies were in fact the closest in the vector space. In some cases, however, the model just doesn’t work as well as I’d like. Because I am only returning one recommendation, it takes one film to jump over a group of more appropriate outcomes.
Some thoughts about improvement. I would like to incorporate collaborative filtering into the recommendation engine to build a hybrid model. This would allow for more novel recommendations that hone in on user behavior. My application could also create a class to build a user profile, thus avoiding the necessity to cold-start. A more comprehensive dataset with a greater amount of features would certainly help, as would a better way to incorporate plot similarity into my model.